 Fairange
Data report · Nov 1, 2026
Heat pump vs furnace costs by U.S. region
Same HVAC wage file, different job assumptions: heat pump mid estimates run well above furnace replacements in every Census region.
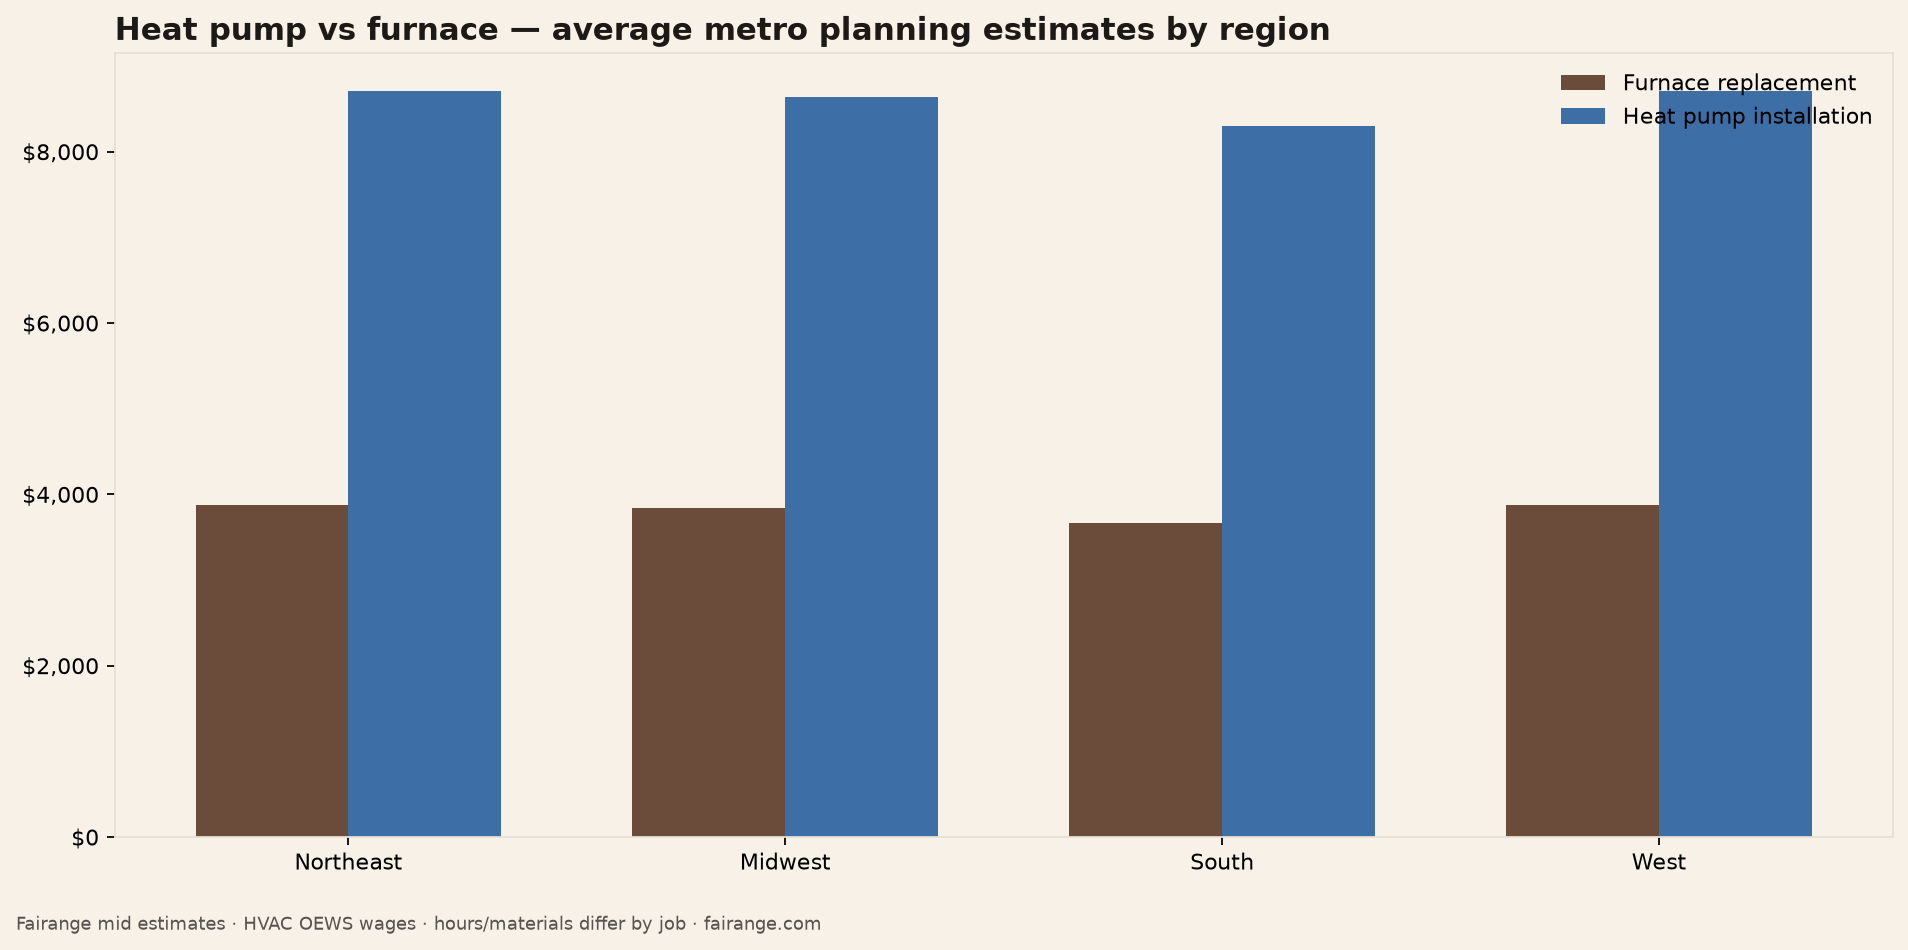
We don’t have utility rates or design-day loads in this dataset — so we’re not crowning a “winner.” What we can show is how our planning estimates for a furnace replacement vs a heat pump install compare once you apply the same local HVAC wage file.
Heat pumps carry higher equipment/hours assumptions in our job table, so they land higher everywhere. By Census region, average metro mid estimates look like this:
| Region | Furnace mid | Heat pump mid | Gap | Metros |
|---|---|---|---|---|
| Northeast | $3,875 | $8,711 | $4,836 | 49 |
| Midwest | $3,839 | $8,639 | $4,800 | 94 |
| South | $3,669 | $8,294 | $4,625 | 155 |
| West | $3,876 | $8,713 | $4,837 | 87 |
The South averages a bit lower on both jobs in our file — reflecting OEWS HVAC wages there — but the heat-pump premium stays large because of the job assumptions, not because the South “needs” different markup math. Federal credits and utility rebates (IRS §25C, ENERGY STAR, DSIRE) can change the homeowner’s net cost; we link those on the methodology and job notes rather than baking unstable credit dollars into the chart.
Compare side by side: furnace vs heat pump.
Also: ZIP calculator · city guides · how we estimate · press kit
By The Fairange team · hello@fairange.com